State of Influence Index 2026 now LIVE - Explore the creators, trends and platforms driving conversations
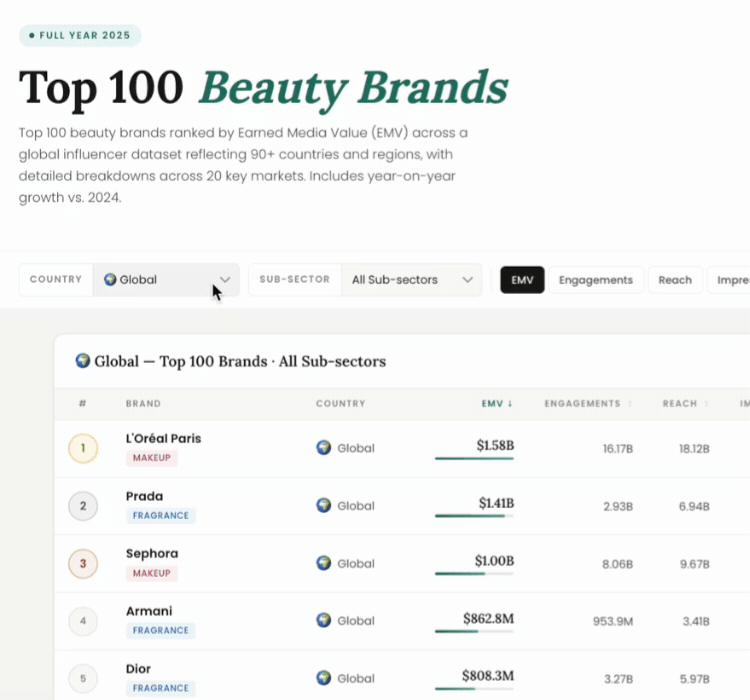
See how the Top 100 beauty brands rank in terms of EMV and learn which trends are shaping the industry in 2026.
Explore →
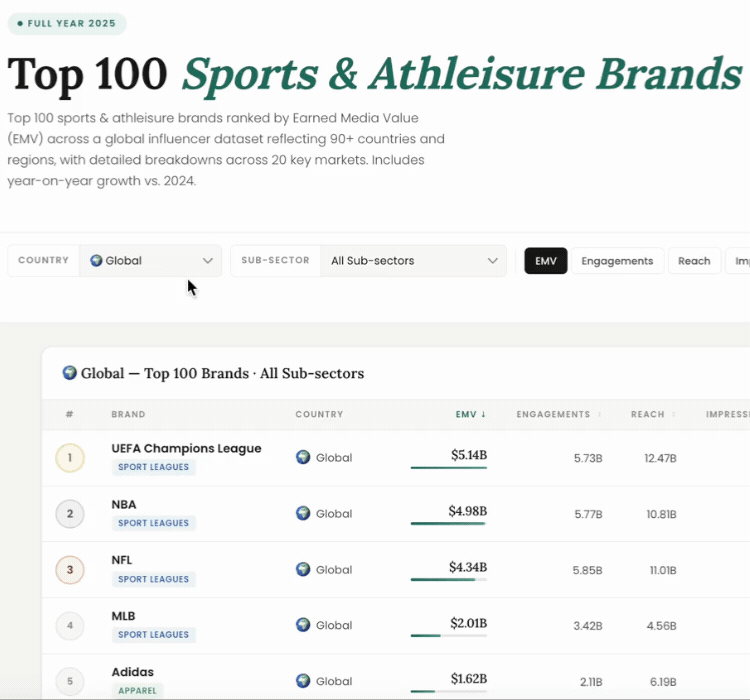
See how the Top 100 sports brand rank in EMV and the trends and creators shaping the industry.
Explore →
Top macro influencers shaping K-beauty globally.
Read more
Discover Q1 2026's top drugstore beauty influencers with engagement insights.
Read more
Influencers shaping the Get Un-Ready With Me movement worldwide.
Read more
Top fragrance influencers redefining scent layering.
Read more
Global beauty influencer analysis and rankings.
Read more
Discover the top 10 sports comedy influencers. Complete analysis with ranking based on EMV.
Read more
Discover the top 10 influencers for match-day related content. Complete analysis with ranking based on EMV.
Read more
Discover the top 10 influencers across the globe for the 'Get Ready With Me – Sports' trend.
Read more
Discover the top 10 influencers posting sports match highlights with engagement rates and media values.
Read more
Discover the top 10 influencers for skills tutorials in sport with engagement rates and media values.
Read more
Discover the top 10 movie review influencers across the globe for 2025. Complete analysis with engagement rates, media values, and editorial insights.
Read more
Discover the top 10 influencers for 'must watch' shows and films. Complete analysis with engagement rates, media values, and insights.
Read more
Discover the top 10 influencers for tv and film fan theories. Complete analysis with engagement rates, media values, and editorial insights.
Read more
Discover the top 10 influencers in 2025 for graphic design tutorials. Complete analysis with engagement rates, media values, and editorial insights.
Read more
Discover the top 10 influencers in parody sketches. Complete analysis with engagement rates, media values, and editorial insights.
Read moreInstagram Reels account for 43% of all posts across all sectors but only 22% of EMV. Long-form YouTube content however represents just 10% of posts but delivers 33% of EMV, averaging $83,138 per post versus $13,377 for a Reel.
But the winning format isn't universal — it's sector-dependent. In Beauty, TikTok leads at $32,191 per post and drives 42% of sector EMV. In Sports & Athleisure and Media & Entertainment, YouTube dominates at $111,446 and $97,319 per post respectively.
Explore the key formats and trends in your industry in our State of Influence Index reports.
Every sector shows the same pattern: YouTube delivers the highest EMV per post by a significant margin, yet remains chronically underused relative to its returns. As that gap becomes harder to ignore, expect brands to reallocate budgets away from high-volume Reels and towards fewer, deeper YouTube partnerships. The brands that move first will set a benchmark others scramble to match.
EMV per post varies by multiples across platforms, even when the creator and format are identical. A brand optimising for creator fit alone — without accounting for platform context — is leaving a significant portion of its return to chance. As platform performance gaps widen across all three sectors, the most successful brands will evaluate platform and creator as a combined decision, not sequential ones.
At +82.9% YoY, TikTok is the fastest-growing platform — and it's not slowing. Brands still treating it as an experimental channel are already behind. The next phase isn't about whether to invest, it's about which creators, which formats, and which markets to prioritise — because the window to build meaningful share before the category consolidates is closing fast.
Facebook grew 78.4% YoY and averages $70,117 EMV per post — second only to YouTube. Yet almost no brand has a Facebook-first creator strategy. The audience is older, more purchase-ready, and less contested for creator attention. The brands that recognise Facebook as a high-return channel before it becomes consensus will find themselves in a category of one.
US creators drive nearly 5× the EMV of the UK, and the gap to continental Europe is wider still. But European creator output is growing, and the cost efficiency remains more favourable than US markets. Brands willing to invest in European creator relationships now — before US-level competition for talent arrives — stand to build category authority in markets that are still genuinely contestable.
Book a demo to reveal which creators and platforms are driving conversations for your brand.