State of Influence Index 2026 now LIVE - Explore the creators, trends and platforms driving conversations
Hello all!
Happy Spring Time (even though the weather may not look it this week in London).
Our data scientists here at Wearisma have been hard at work making sense of all influencer data from all parts of the world. This month we focused on extracting the top trends in the UK Beauty Market.
Stay tuned and enjoy! We will be covering other markets in the months to come.
As always, any feedback or comments or if you want to get in touch, feel free to email us at .
Best,
The Wearisma Team
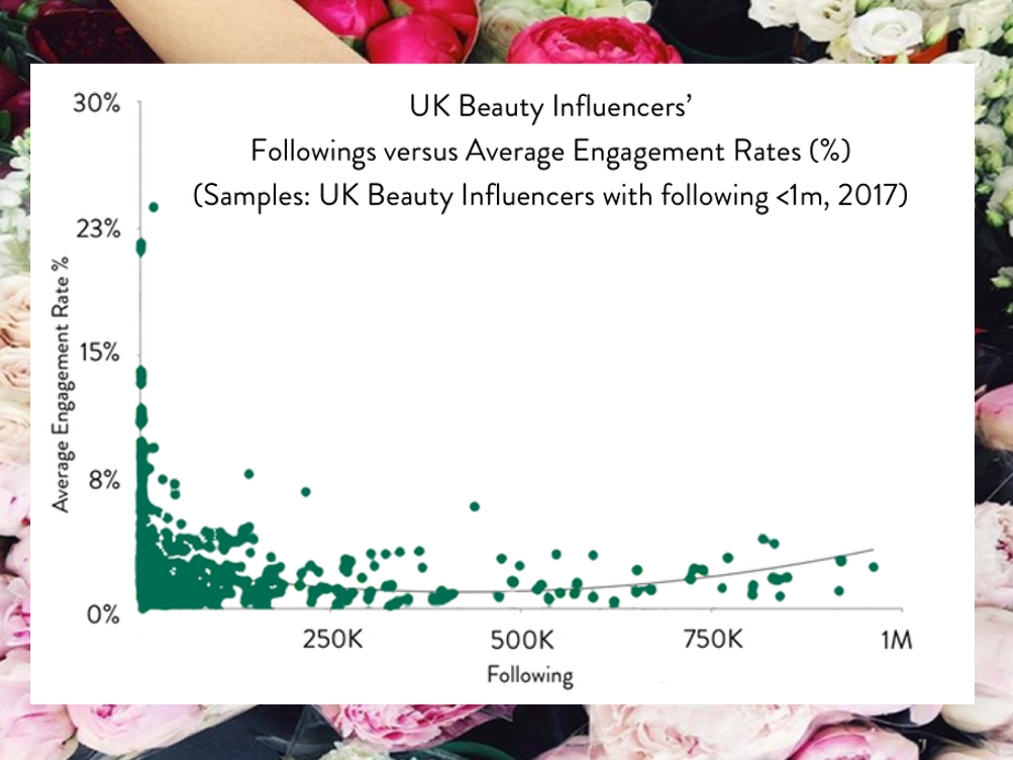
1. On average, influencers small and large command a higher engagement rate than those in between.
2. Performances do vary wildly within a given size – careful evaluation & selection is therefore critical.
3. We see high concentration of following & engagement by top influencers, when ranked by following/size and by average engagements per post.
4. New socially driven digital brands are seeing success in the top chart.
5. Q2-17 was the most popular quarter for sponsored posts. Opportunities to do more in Q3 and Q4?
1. On average, influencers small and large command a higher engagement rate than those in between.
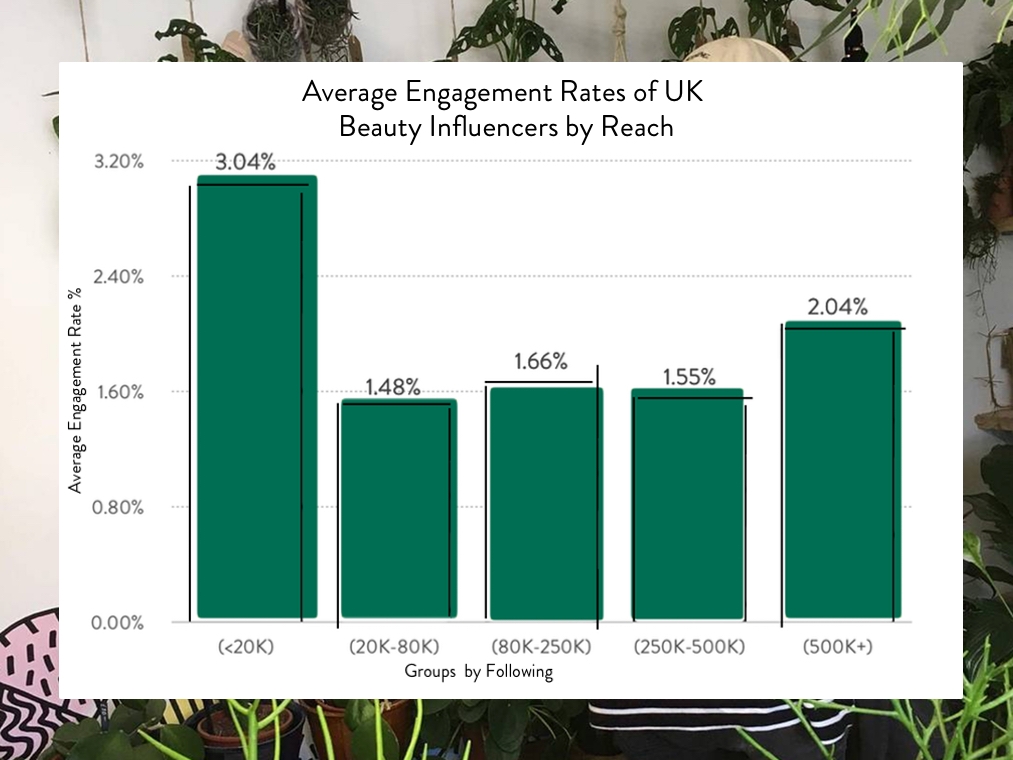
On average, micro-influencers (<20k following) command higher engagement rate and regional/global influencers (>500k following) command close to 2X and 1.4X engagement rates to those between 20k-500k respectively.
2. Performances do vary wildly within a given size – careful evaluation & selection is therefore critical.
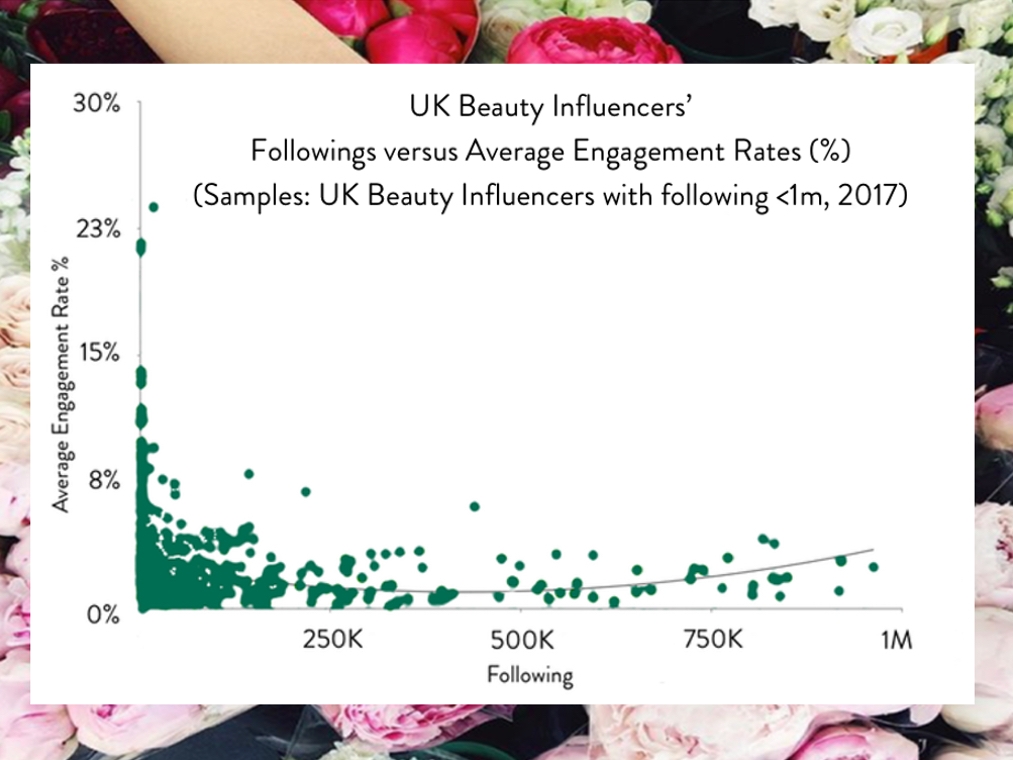
Performances differ widely, across all following group. Choosing to work with the right influencers will have a real impact on outcome.
3. We see high concentration of following & engagement by top influencers, when ranked by following/size and by average engagements per post.
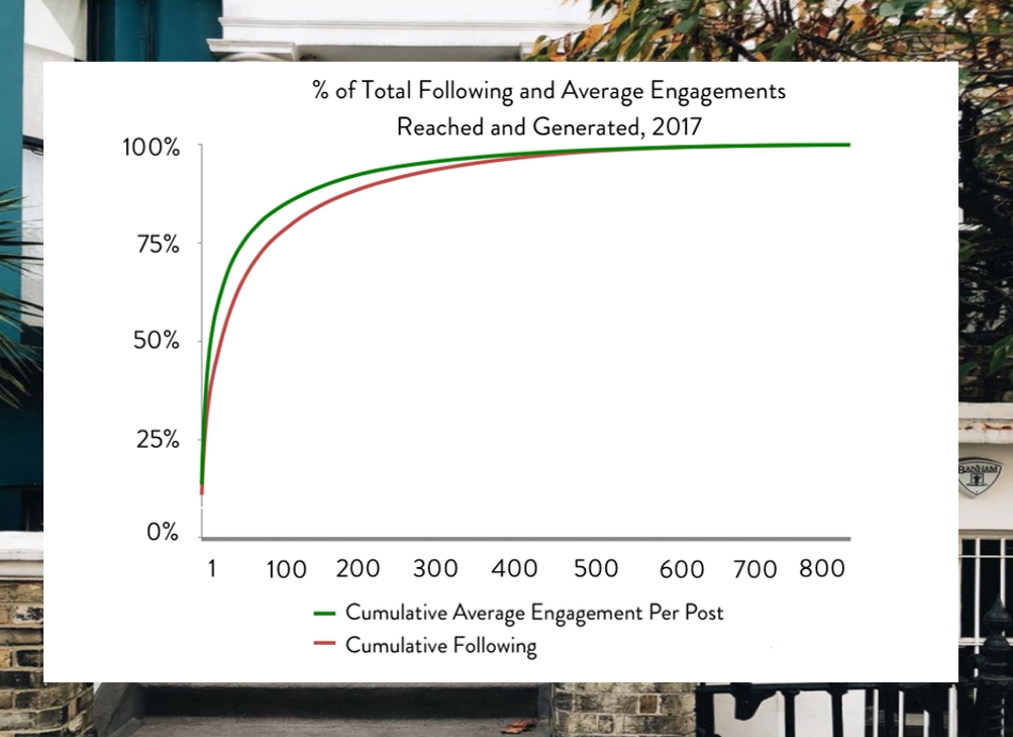
Top 125 influencers by following (>150k+) account for 80% of total following reached. Top 80 influencers by average engagement (>2,600 engagements per post) account for 80% of average engagement per post generated. However, while top influencers are good for awareness and engagements, brands need to supplement their strategies with micro-influencers to activate key passion groups.
4. New socially driven digital brands are seeing success in the top chart.
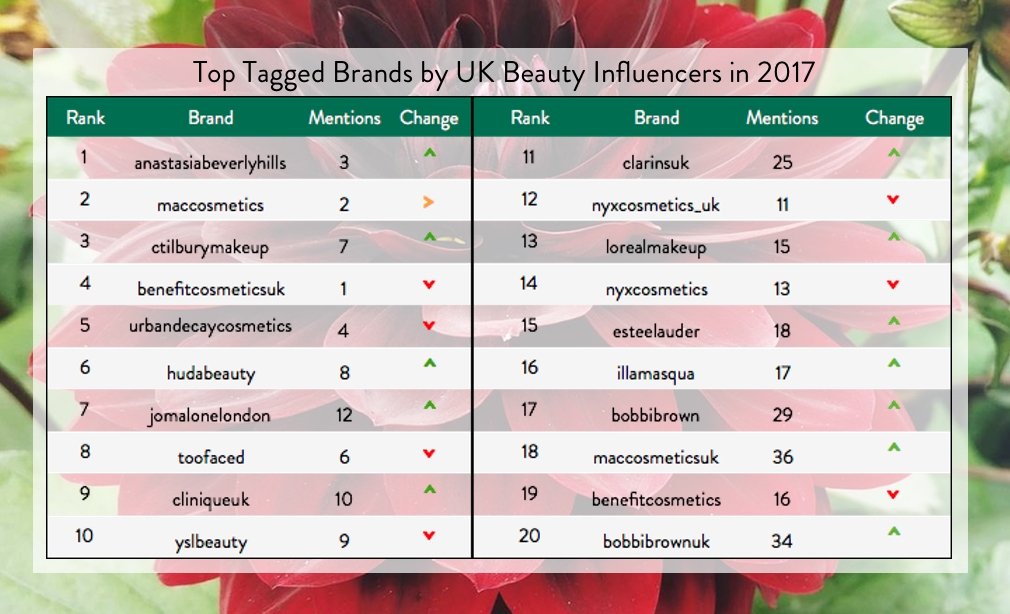
To be in the top 20 you need to increase the amount of mentions by UK influencers by at least 6X between 2016 and 2017 as the overall volume has grown by that much!
5. Q2-17 was the most popular quarter for sponsored posts. Opportunities to do more in Q3 and Q4?
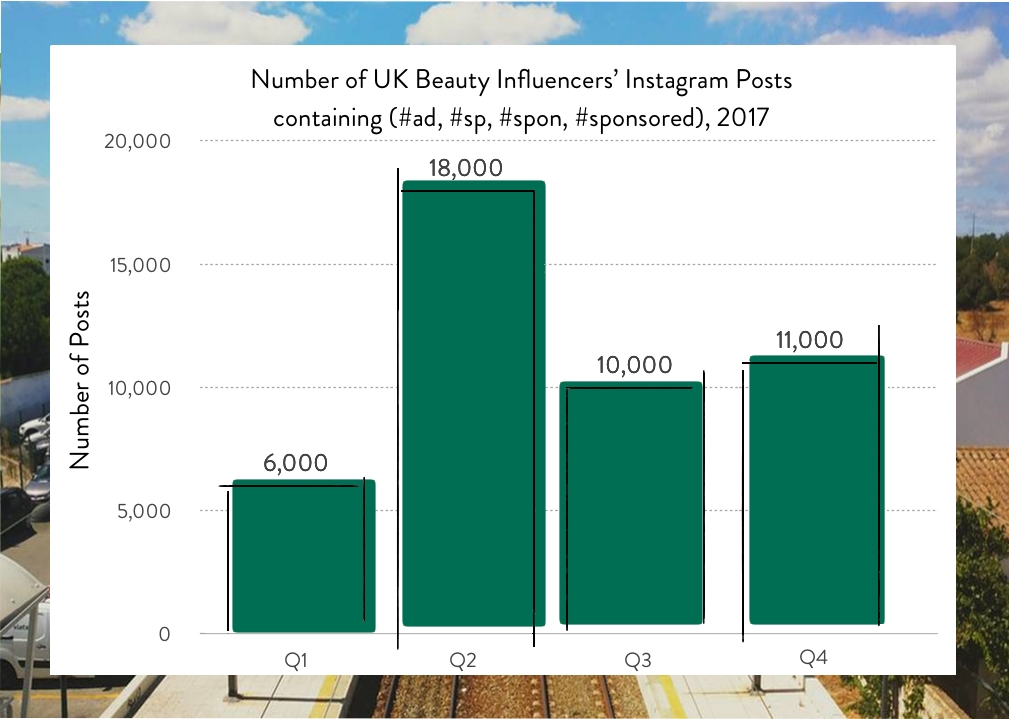
To increase the chance of your sponsored content being seen by your target consumers, it would be advantageous to avoid campaigns landing during Q2 when Instagram has a higher proportion of sponsored content. Consumers can become disillusioned to sponsored content if they feel it is dominating an influencers feed.
Bonus Insight: it’s not all about following and engagement.
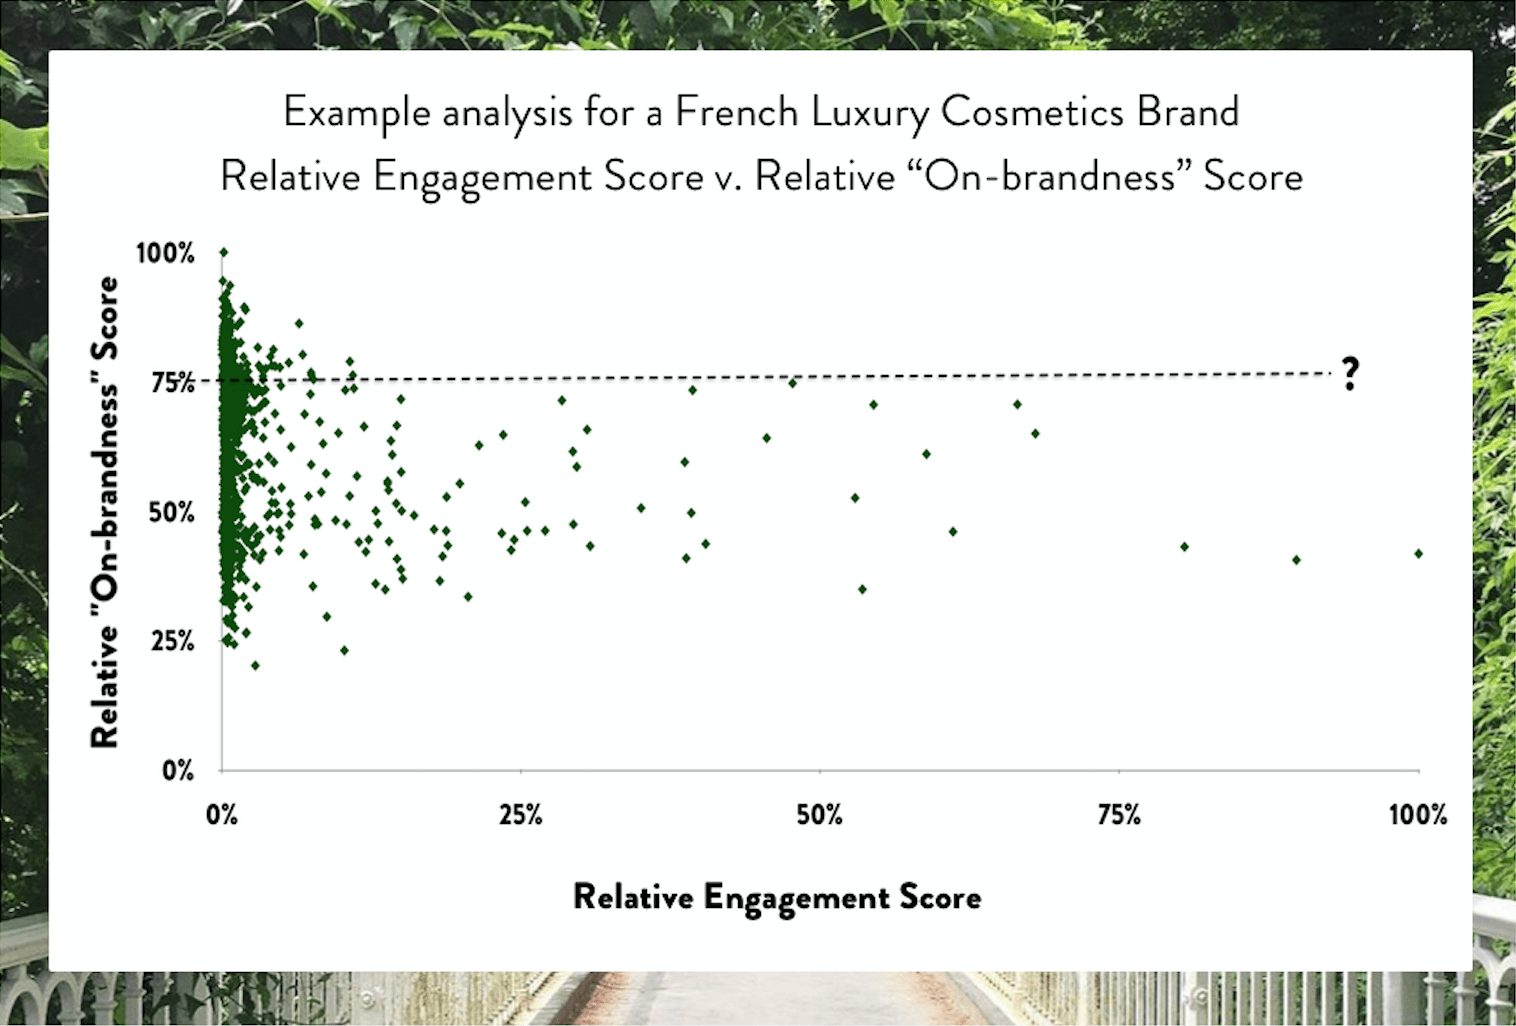
Depending on your brand positioning, there can be a trade-off between picking “on-brand” influencers versus “engaged” influencers.